
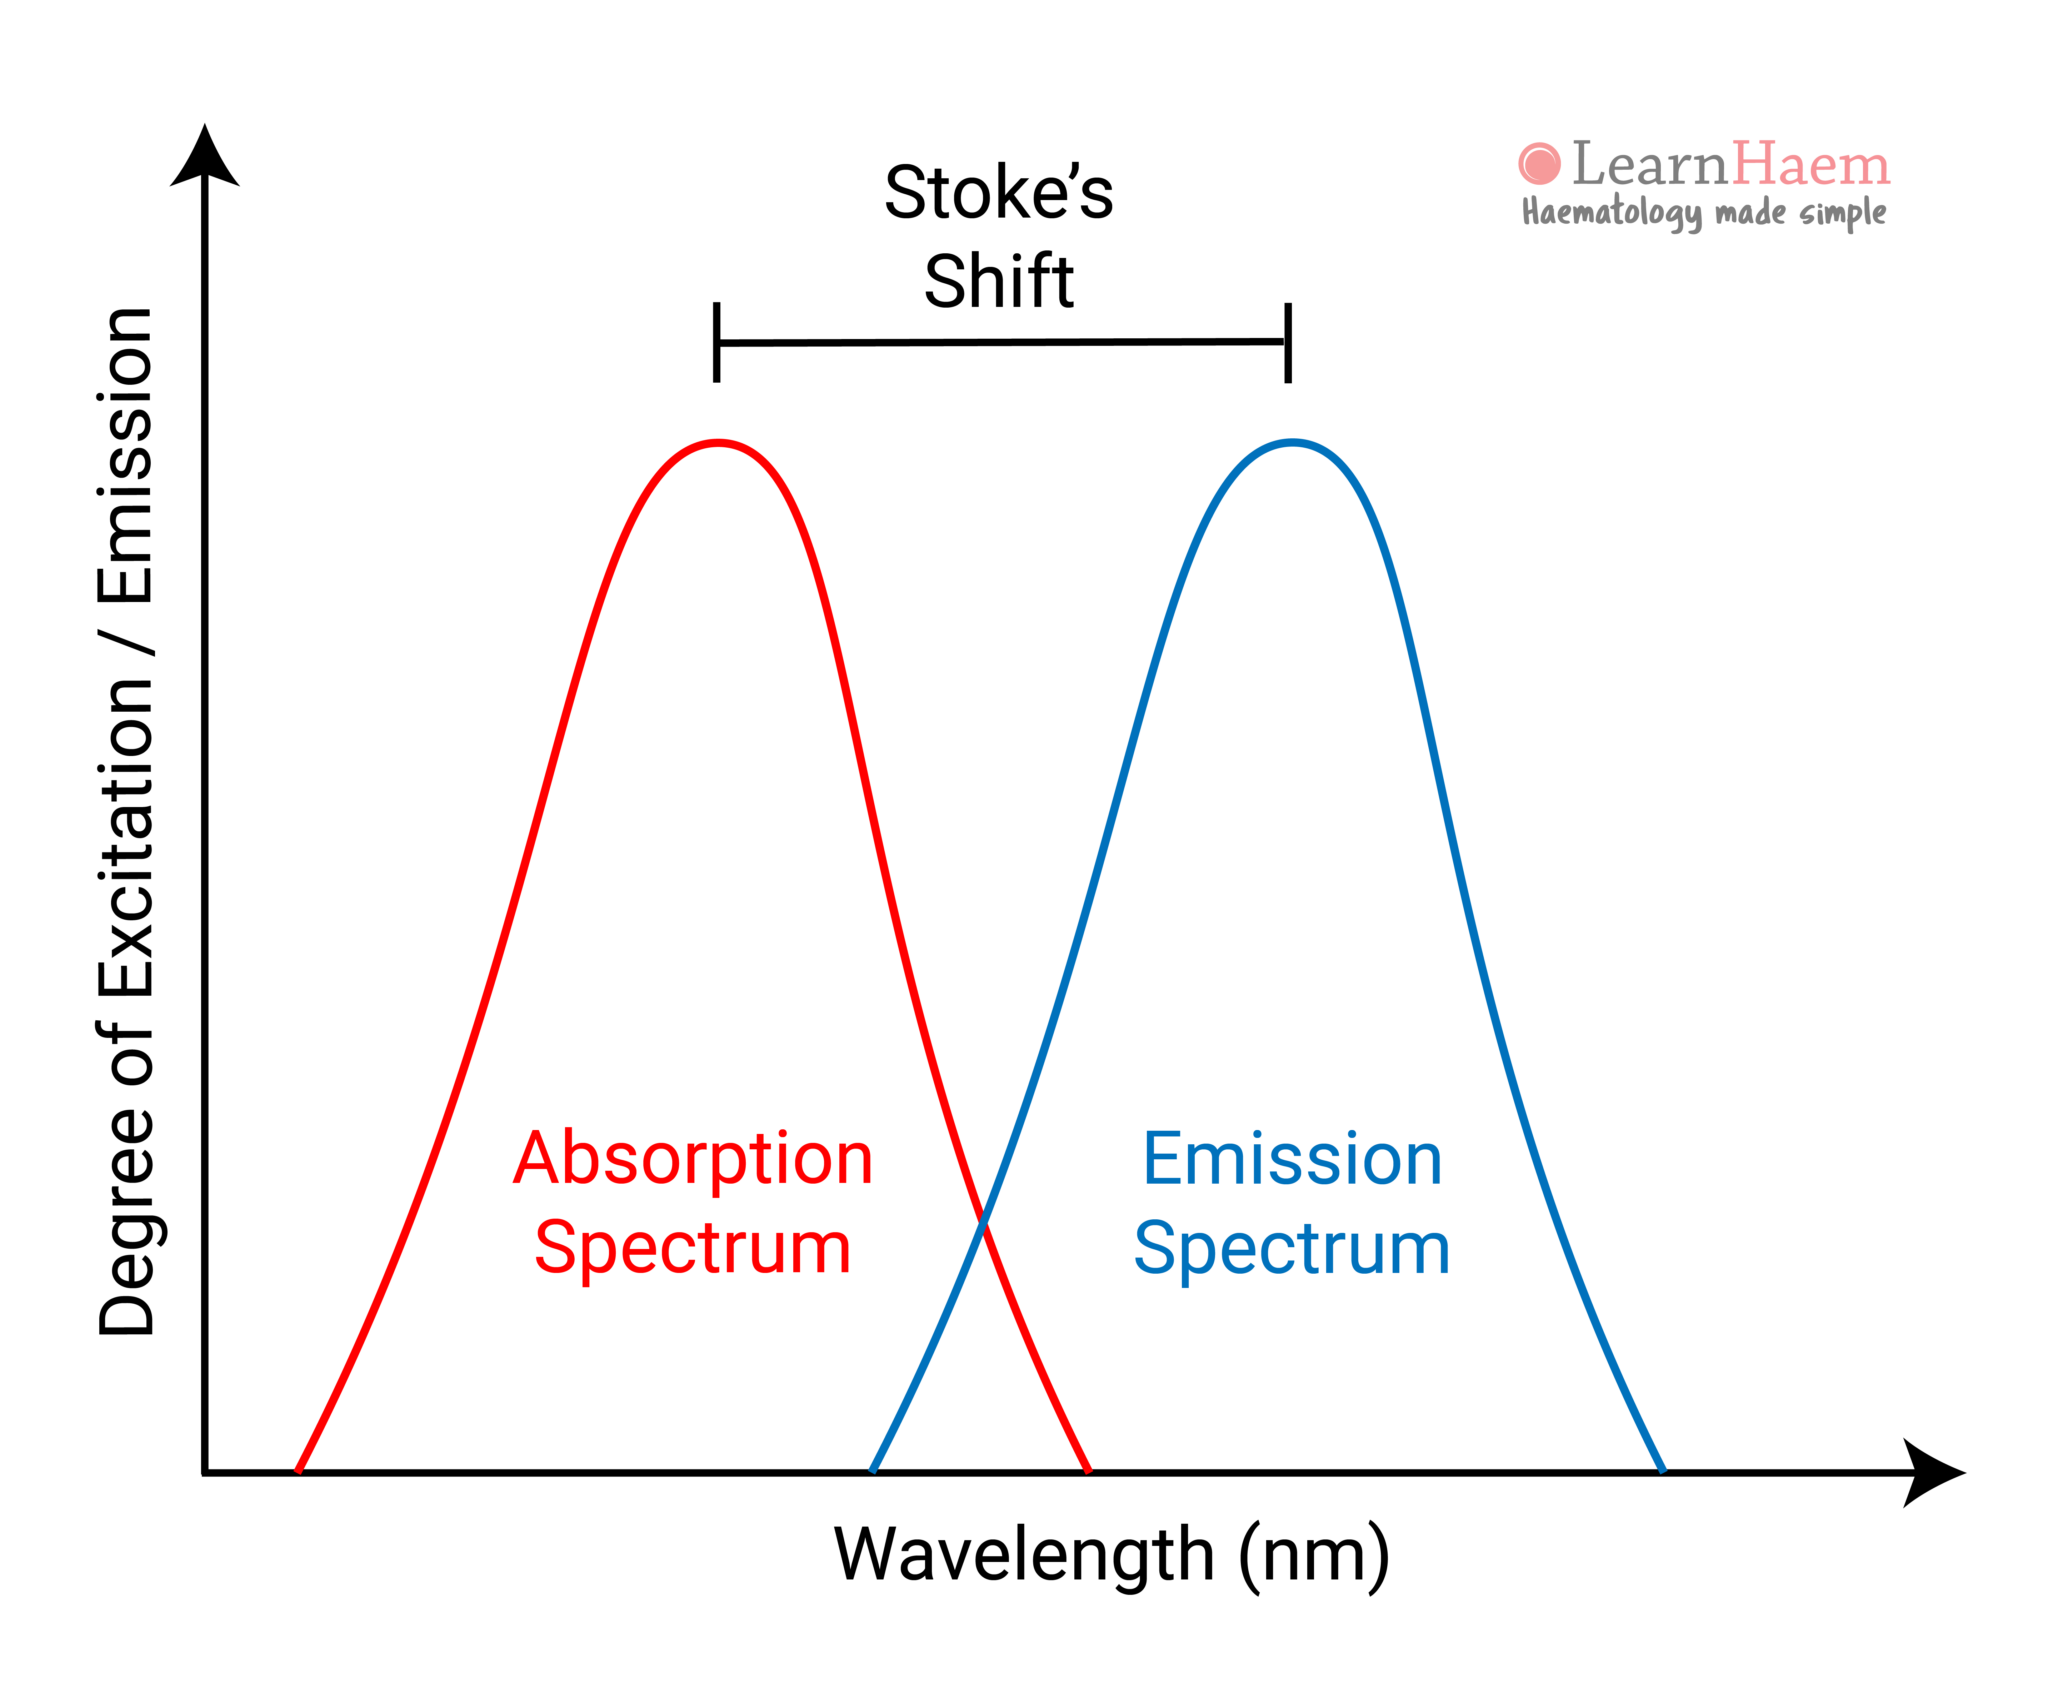
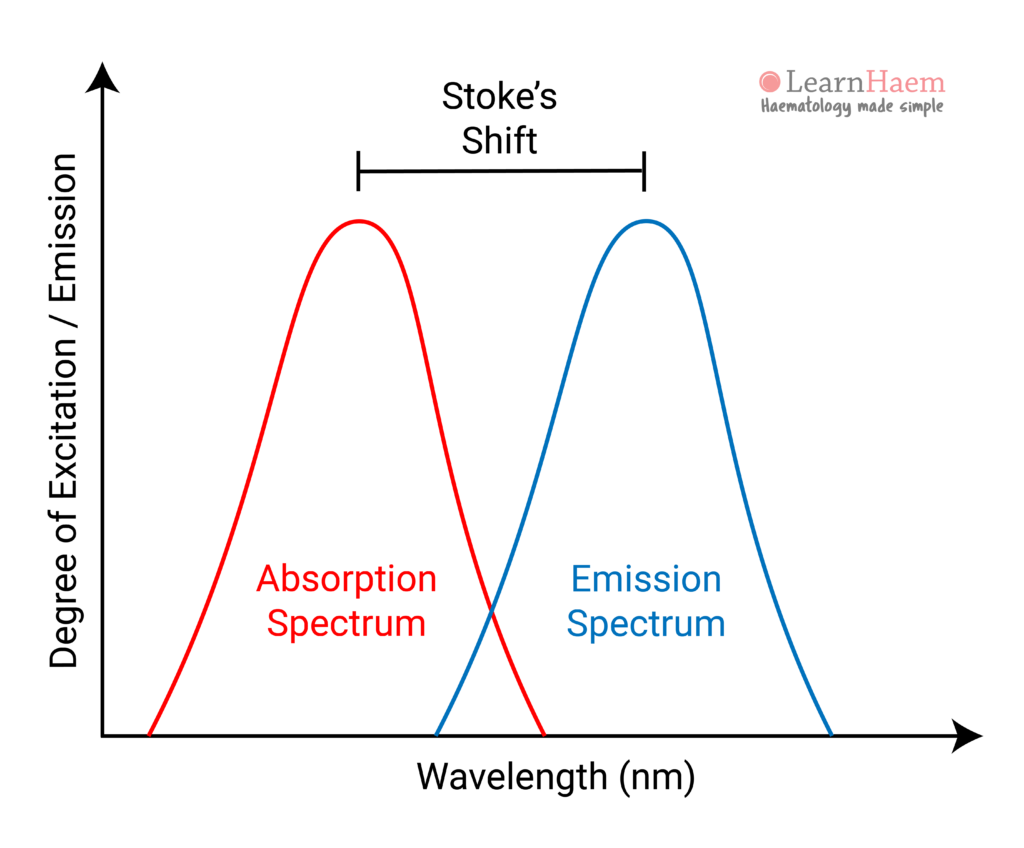
Immunophenotyping of cells via flow cytometry relies on release of fluorescent signals from fluorochromes bound to monoclonal antibodies. When these fluorochromes are excited by specific wavelengths of light (the excitation or absorption wavelength of a fluorochrome), they absorb the light, gaining energy and releasing it as photons of light. The emitted wavelength can be recorded and analysed to determine the phenotype of the cell.
Common Excitation and Emission Wavelengths
| Fluorochrome | Excitation (nm) | Emission (nm) |
|---|---|---|
| Allophycocyanin (APC) | 650 | 660 |
| APC-cyanine 7 (APC-Cy7) | 650 | 785 |
| Fluorescein isothiocyanate (FITC) | 494 | 519 |
| Pacific blue (PB) | 410 | 455 |
| Peridinin-chlorophyll (PerCP) | 482 | 678 |
| PerCP-cyanine 5.5 (PerCP-Cy5.5) | 482 | 678 |
| Phycoerythrin (PE) | 496, 546 | 578 |
| PE-cyanine 5 (PE-Cy5) | 496, 546 | 667 |
| PE-cyanine 5.5 (PE-Cy5.5) | 495, 564 | 696 |
| PE-cyanine 5 (PE-Cy7) | 495, 564 | 767 |
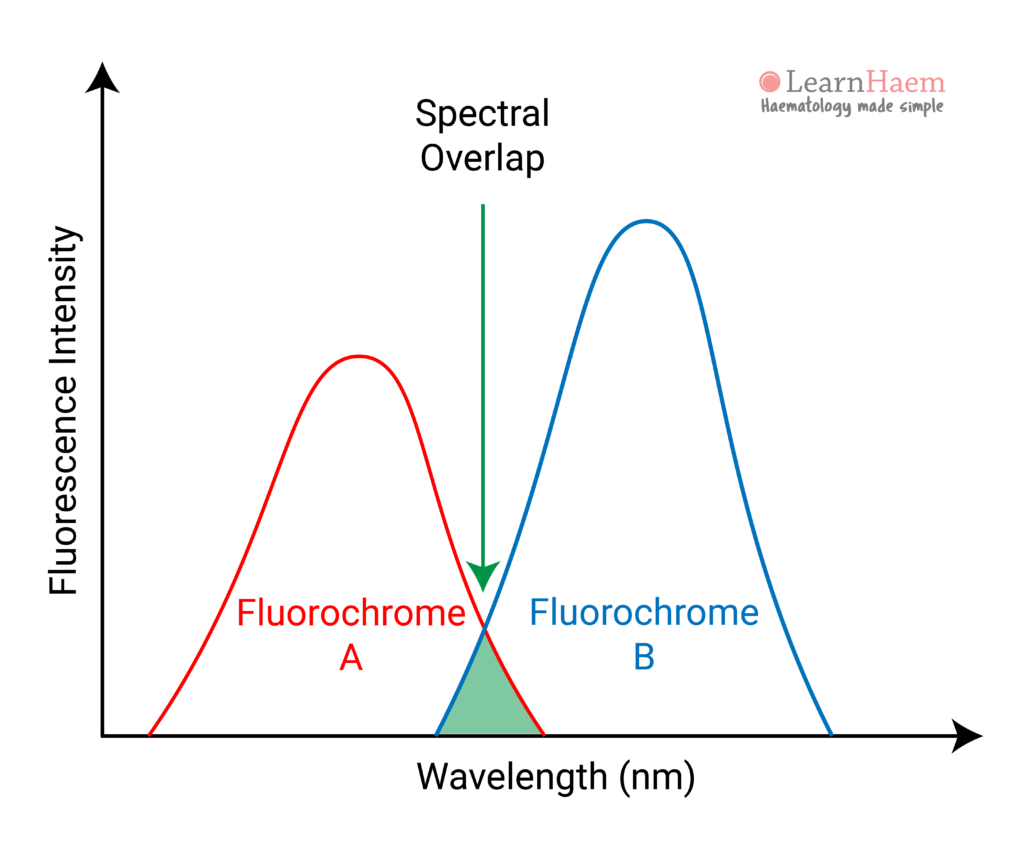
Spectral Overlap
As demonstrated in the figure and table above, light emissions occur over a spectrum. Different fluorochromes can have overlapping emission spectra, which can result in emissions from one fluorochrome spilling over into a detector designed for another fluorochrome. This is known as spectral overlap, and must be corrected by compensation to reduce the analytical interference from this phenomenon.
Leave A Comment